Loading
Analytics
Know exactly how every chair, shop and day is performing
CheckIn analytics turn the work your salon already does into decision-grade dashboards, reporting on visits, revenue, wait times and staff performance for your whole business, one location, or one person.
Most salons run on gut feel and a shoebox of receipts
You can feel when a day was busy. What you cannot see is whether Tuesday afternoons quietly lose money, which service drives the most repeat visits, or how long your walk-in clients really wait before someone takes them. That guesswork costs you.
The usual answer is a spreadsheet someone updates when they remember, or a point-of-sale report that only counts the till. Neither tells you why a tech is fully booked while the chair next to them sits empty, and neither rolls up cleanly when you open a second or third location.
CheckIn already records every check-in, assignment and completed service as it happens. Analytics reads that live activity and gives it back to you as plain numbers you can act on, with no extra data entry and no end-of-month scramble.
How CheckIn analytics works
- 1
Your day creates the data
Every walk-in, booking, staff assignment and completed service is recorded the moment it happens. There is no separate log to keep and nothing to reconcile later.
- 2
Numbers roll up at three levels
The same activity is aggregated for one shop, for your whole business across every location, and for each individual staff member, so owners, managers and techs each see the view that matters to them.
- 3
Revenue is counted from completed services
When a visit is marked complete, the price of the services performed is what counts toward revenue. Your reporting reflects work that actually got done, not bookings that never showed.
- 4
Wait times are measured, not estimated
CheckIn tracks how long clients sit in the queue before a staff member takes them, so the wait number on your dashboard is a real measurement of your front of house.
- 5
Charts and tables make it readable
Dashboards present the figures as visual charts and clear breakdowns by service, staff and time, so a trend is obvious at a glance rather than buried in rows.
- 6
Export when you need it elsewhere
Pull the views you care about out of CheckIn when you want to share them with a partner, an accountant, or your own deeper analysis.
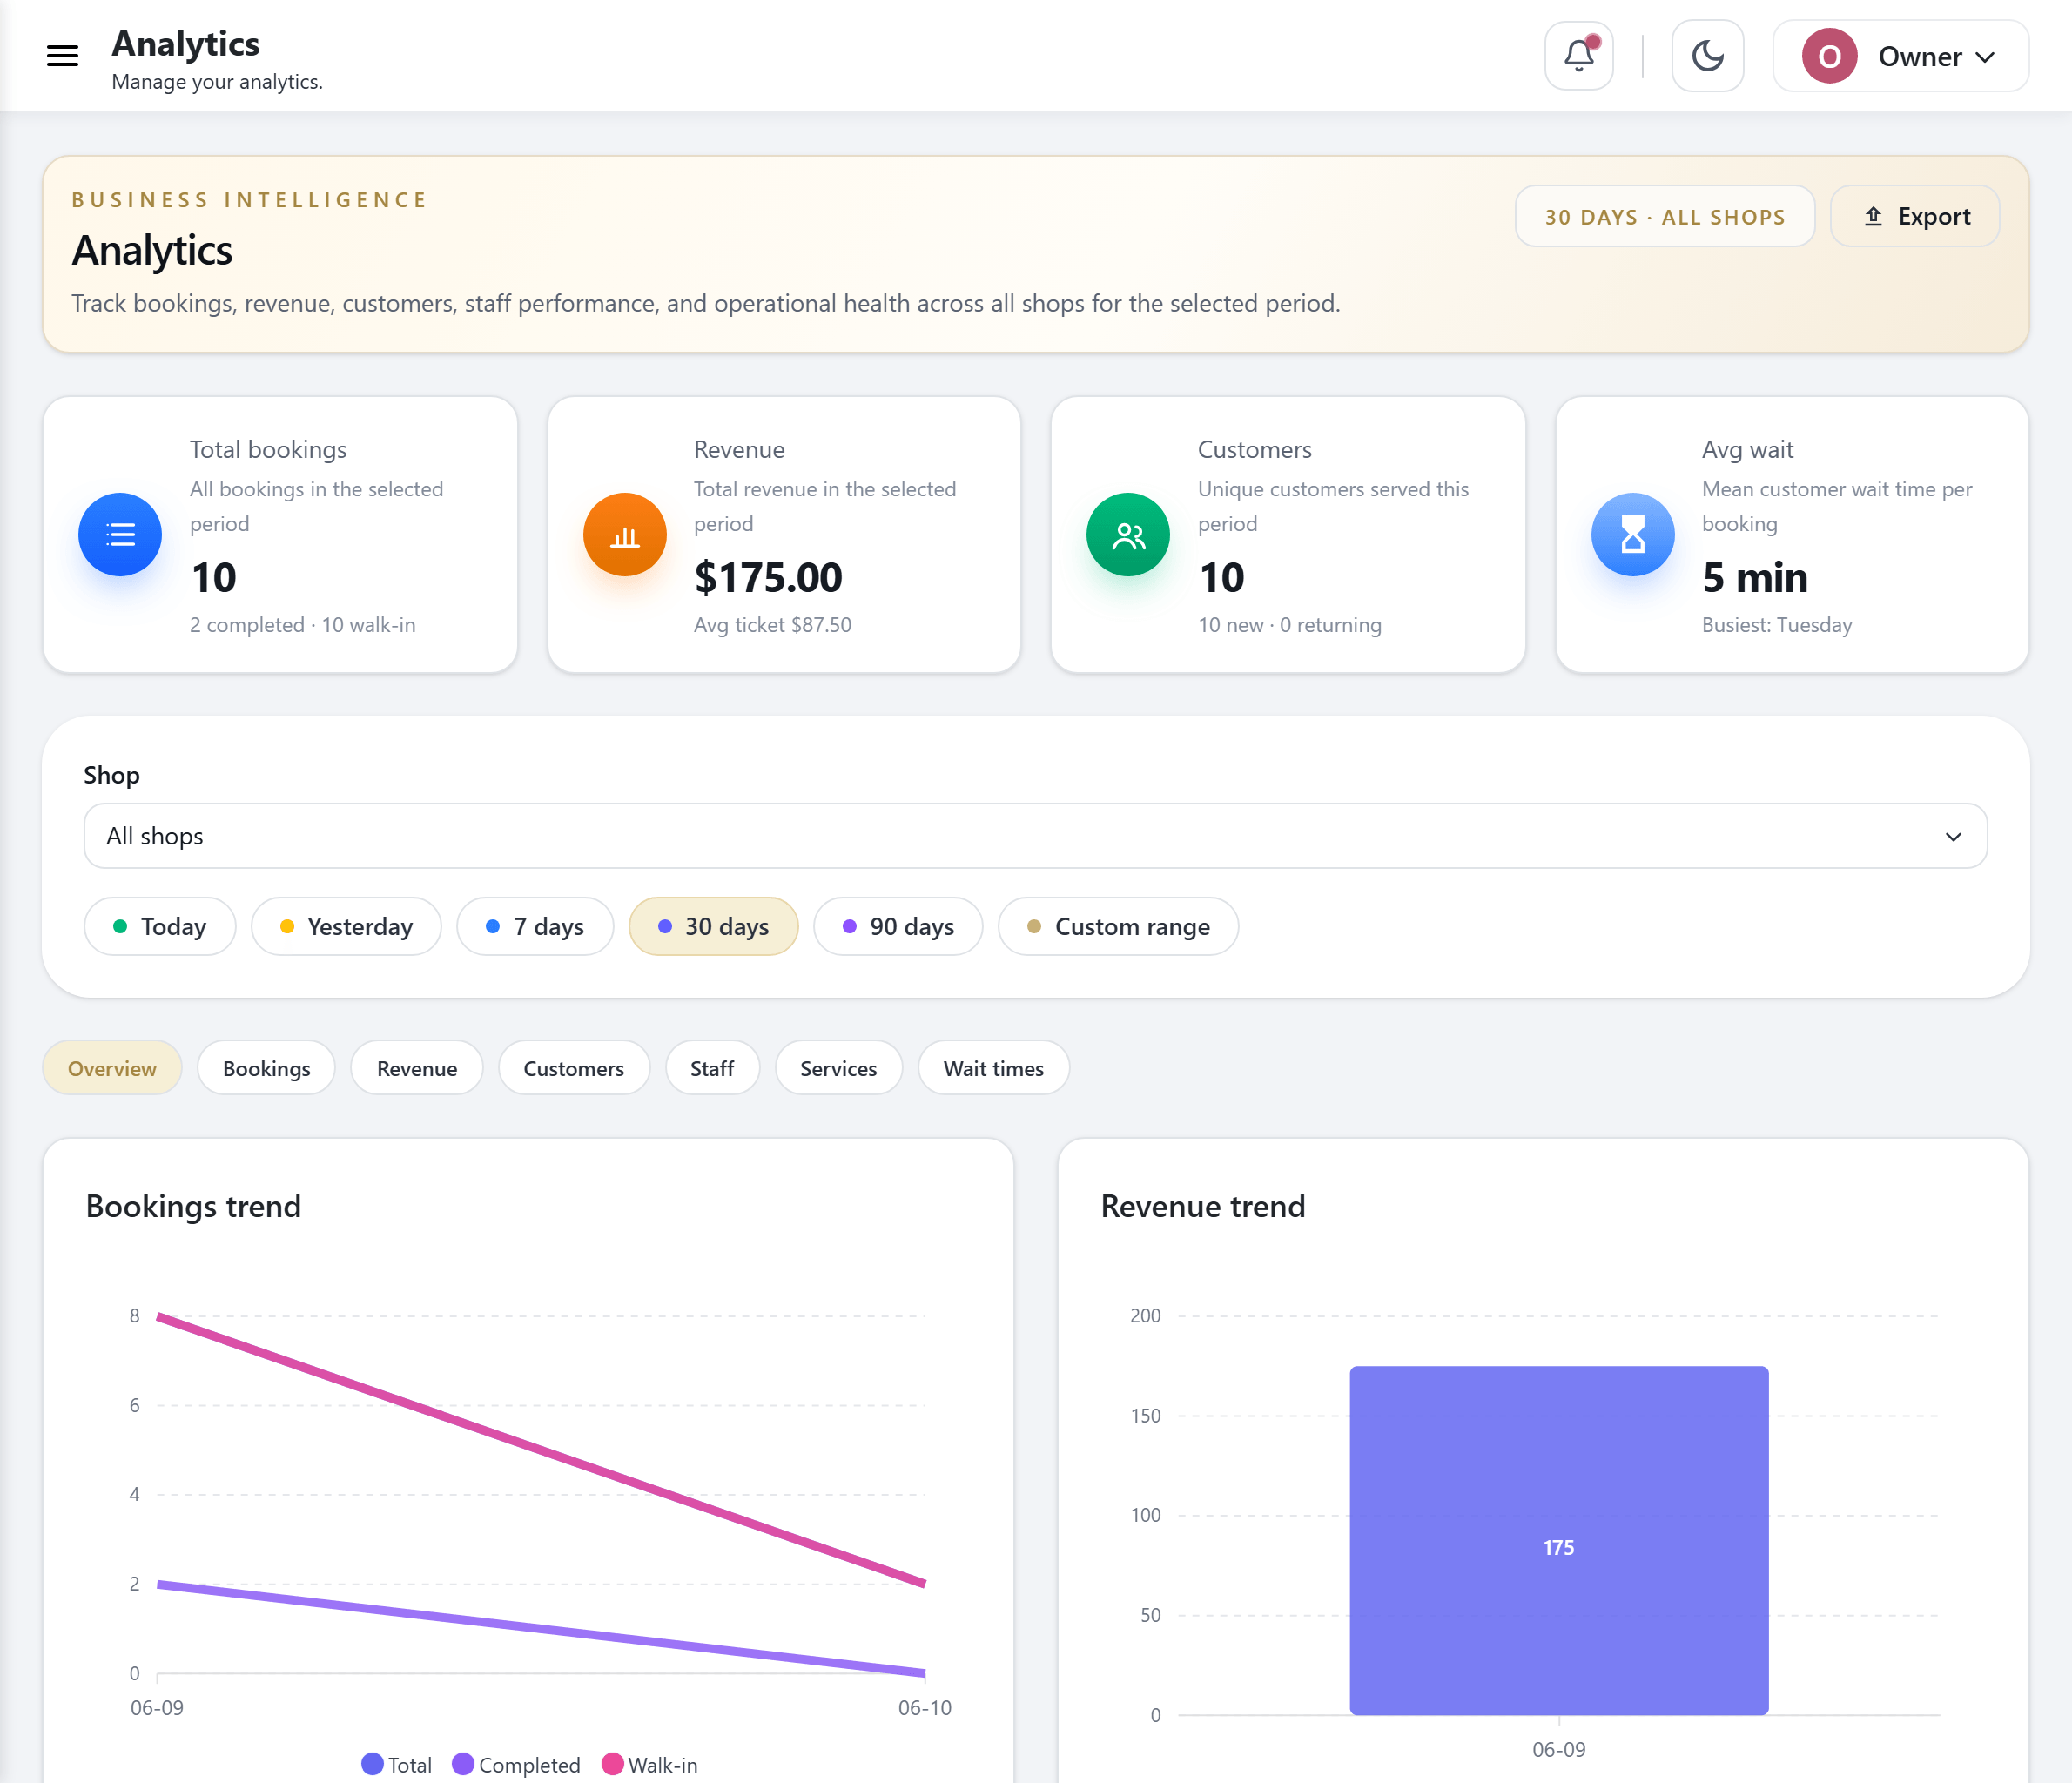
What the dashboards cover
Per-shop dashboard
One screen per location covering bookings, revenue, customers, staff performance, wait times and service breakdowns, so a manager can run their salon from the numbers.
Org-wide overview
A single roll-up across all of your locations, with billing and subscription context alongside it, so an owner sees the whole business without logging in and out of each shop.
Personal staff dashboards
Each staff member sees their own performance and stats, which keeps the team honest about its own numbers and takes the awkward bookkeeping out of one-on-ones.
Revenue from completed services
Revenue is derived from the services actually performed on completed visits, giving you a clean picture of earned work rather than a forecast.
Wait-time analytics
See how long clients really wait before they are seen, so you can staff the rush, set fair expectations at the kiosk, and protect the walk-in experience.
Service breakdowns
Understand which services pull the volume and which pull the revenue, broken out so you can price, promote and schedule around what your salon is known for.
Staff performance
Compare completed visits and output across the team per shop, and spot who is at capacity and who has room before clients feel the difference.
Visual charts and exports
Every level is presented as readable charts and breakdowns, with exportable views when you need the figures outside the dashboard.
Who it is for
Owners and operators
If you are responsible for the bottom line, the org-wide overview puts revenue, visits and location performance in one place, so you can compare shops without chasing six different reports.
Shop managers
Run the floor from a per-shop dashboard: watch wait times during the rush, see which services are moving, and check that the team is balanced across the chairs.
Individual staff
Techs, stylists and therapists see their own completed visits and stats on a personal dashboard, which makes progress visible and reviews straightforward.
Multi-location chains
Nail salons, head spas, day spas, med spas and salon groups get a clean roll-up across every location, with each shop still measured on its own.
Questions, answered
What can CheckIn analytics tell me about my salon?
CheckIn analytics report on bookings, revenue, customers, staff performance, wait times and service breakdowns. You can view them for a single location, for your whole business across every location, or for one individual staff member.
How does CheckIn calculate revenue?
Revenue is derived from completed services. When a visit is marked complete, the price of the services performed counts toward revenue, so your numbers reflect work that actually got done rather than bookings that may not have shown.
Can I see results across all my locations at once?
Yes. The org-wide overview rolls up every location into one view, with billing and subscription context included, and each shop also keeps its own dashboard so you can compare locations side by side.
Does CheckIn track how long clients wait?
Yes. Wait-time analytics measure how long clients actually sit in the queue before a staff member takes them, so the figure on your dashboard is a real measurement of your front of house, not an estimate.
Can each staff member see their own numbers?
Yes. Personal dashboards give every staff member a view of their own performance and stats. The team sees what it produced, and managers can use the same figures in reviews.
Can I export the reports?
Yes. Dashboards are presented as visual charts and breakdowns, and you can export the views you need when you want to share figures with a partner or accountant or analyze them elsewhere.
See CheckIn on your own salon’s flow
Book a 20-minute demo and we’ll show you the queue, kiosk and loyalty running on a setup like yours.